There are several things that affect a person’s user experience. When delivering something to a user, it’s good to ask yourself several things.
For example:
-
Is it useful?
-
Is it valuable?
-
Is it findable?
-
Is it accessible?
You may already be asking yourselves these questions. However, it’s not always easy to ensure that all of the boxes are ticked, or to find out what your existing user experience is like without user testing, which can take up both time and resource.
This is where analytics can provide you with knowledge and insights that can make a huge difference.
For example, here at Invotra, our product integrates with Matomo.
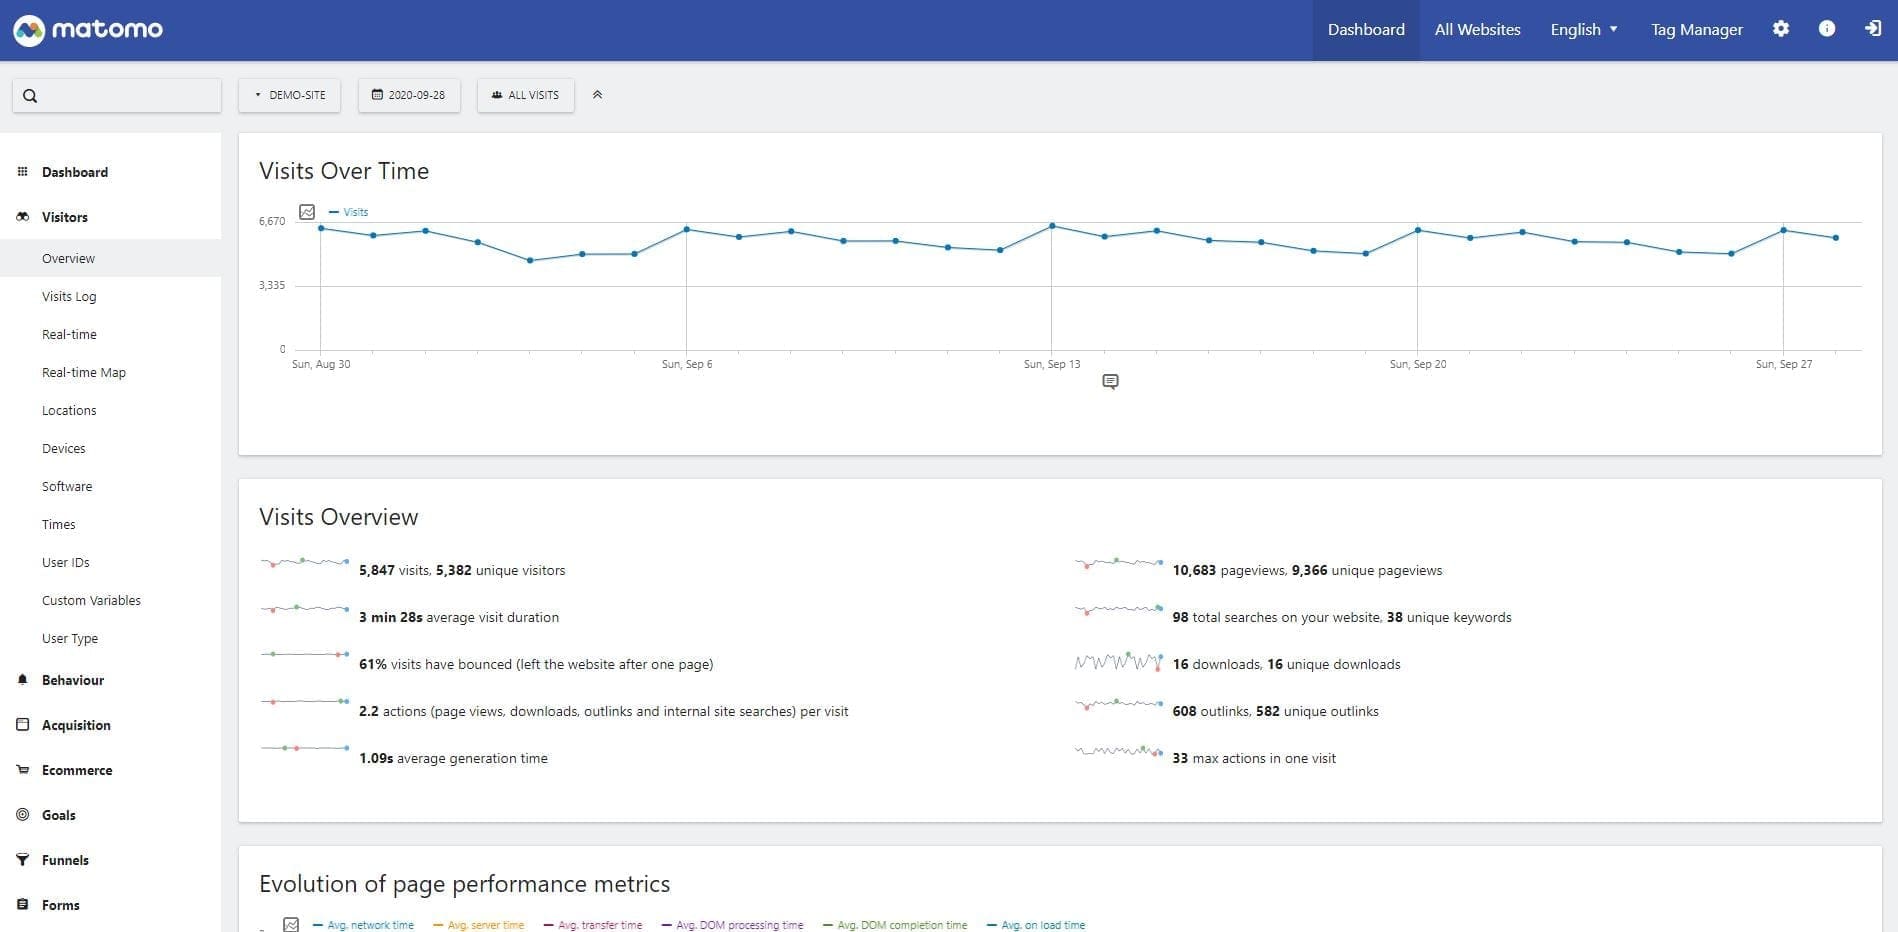
Matomo offers real time web analytics reports. For each visitor, you can see all of their attributes:
-
date
-
number of actions
-
time spent on the site
-
country
-
browser
-
operating system
-
whether the visitor is new or a returning visit
In order for this data to be of use, you want to go beyond “hits”, and instead read deeper to find out what people find relevant and important, how they interact with this and what those interactions lead to.
There are some pretty basic things that can help you here. Take time spent on the site, for example. If you can see that multiple users are engaging for long periods of time with a certain page or piece of content, you might choose to promote it.
Another example… the dates people are hitting your site. If you notice that activity is always higher on a Monday morning, you might choose to announce or promote something at that time.
As a leading intranet and portal supplier, we have grown to fully understand the challenges our customers face when it comes to user experience and engagement.
We encourage our customers to dive deeper than just looking at the ‘top-level’ analytics when trying to make a change.
For example, another feature of Matomo is click mapping. This clearly shows where users are drawn to on a page, meaning that you can then build your pages to have the best chances of success. You can also see what is being ignored. You might then choose to move this to a more optimal position or decide to remove it.


We make it easy for our customers to act on their findings by providing our In-Place-Editor feature. Users with the appropriate permissions are given the tools, flexibility, and control to make real-time changes by simply dragging and dropping.
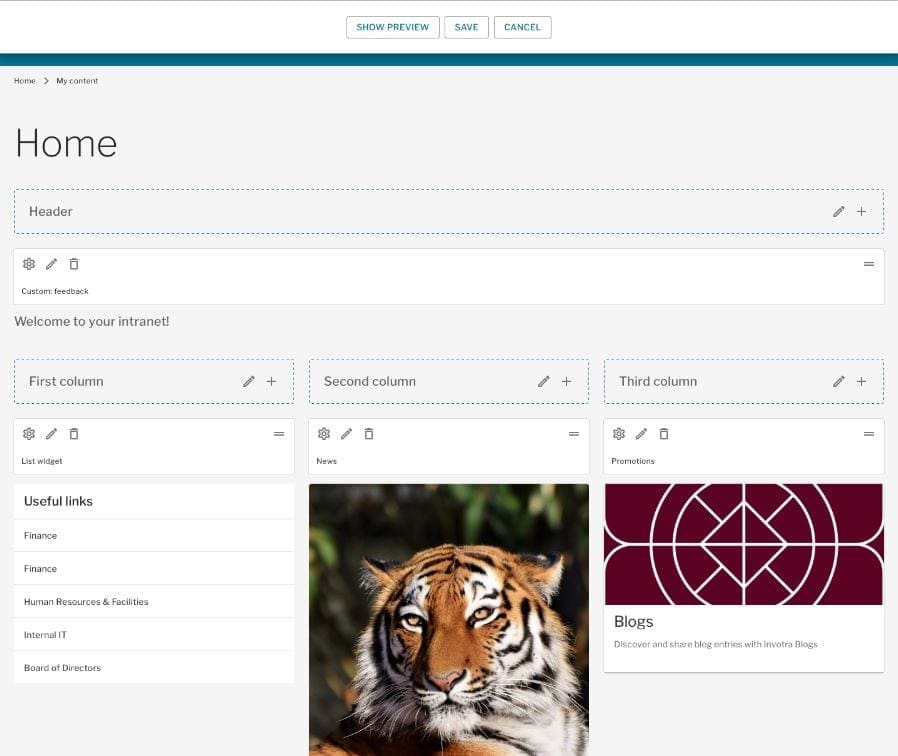
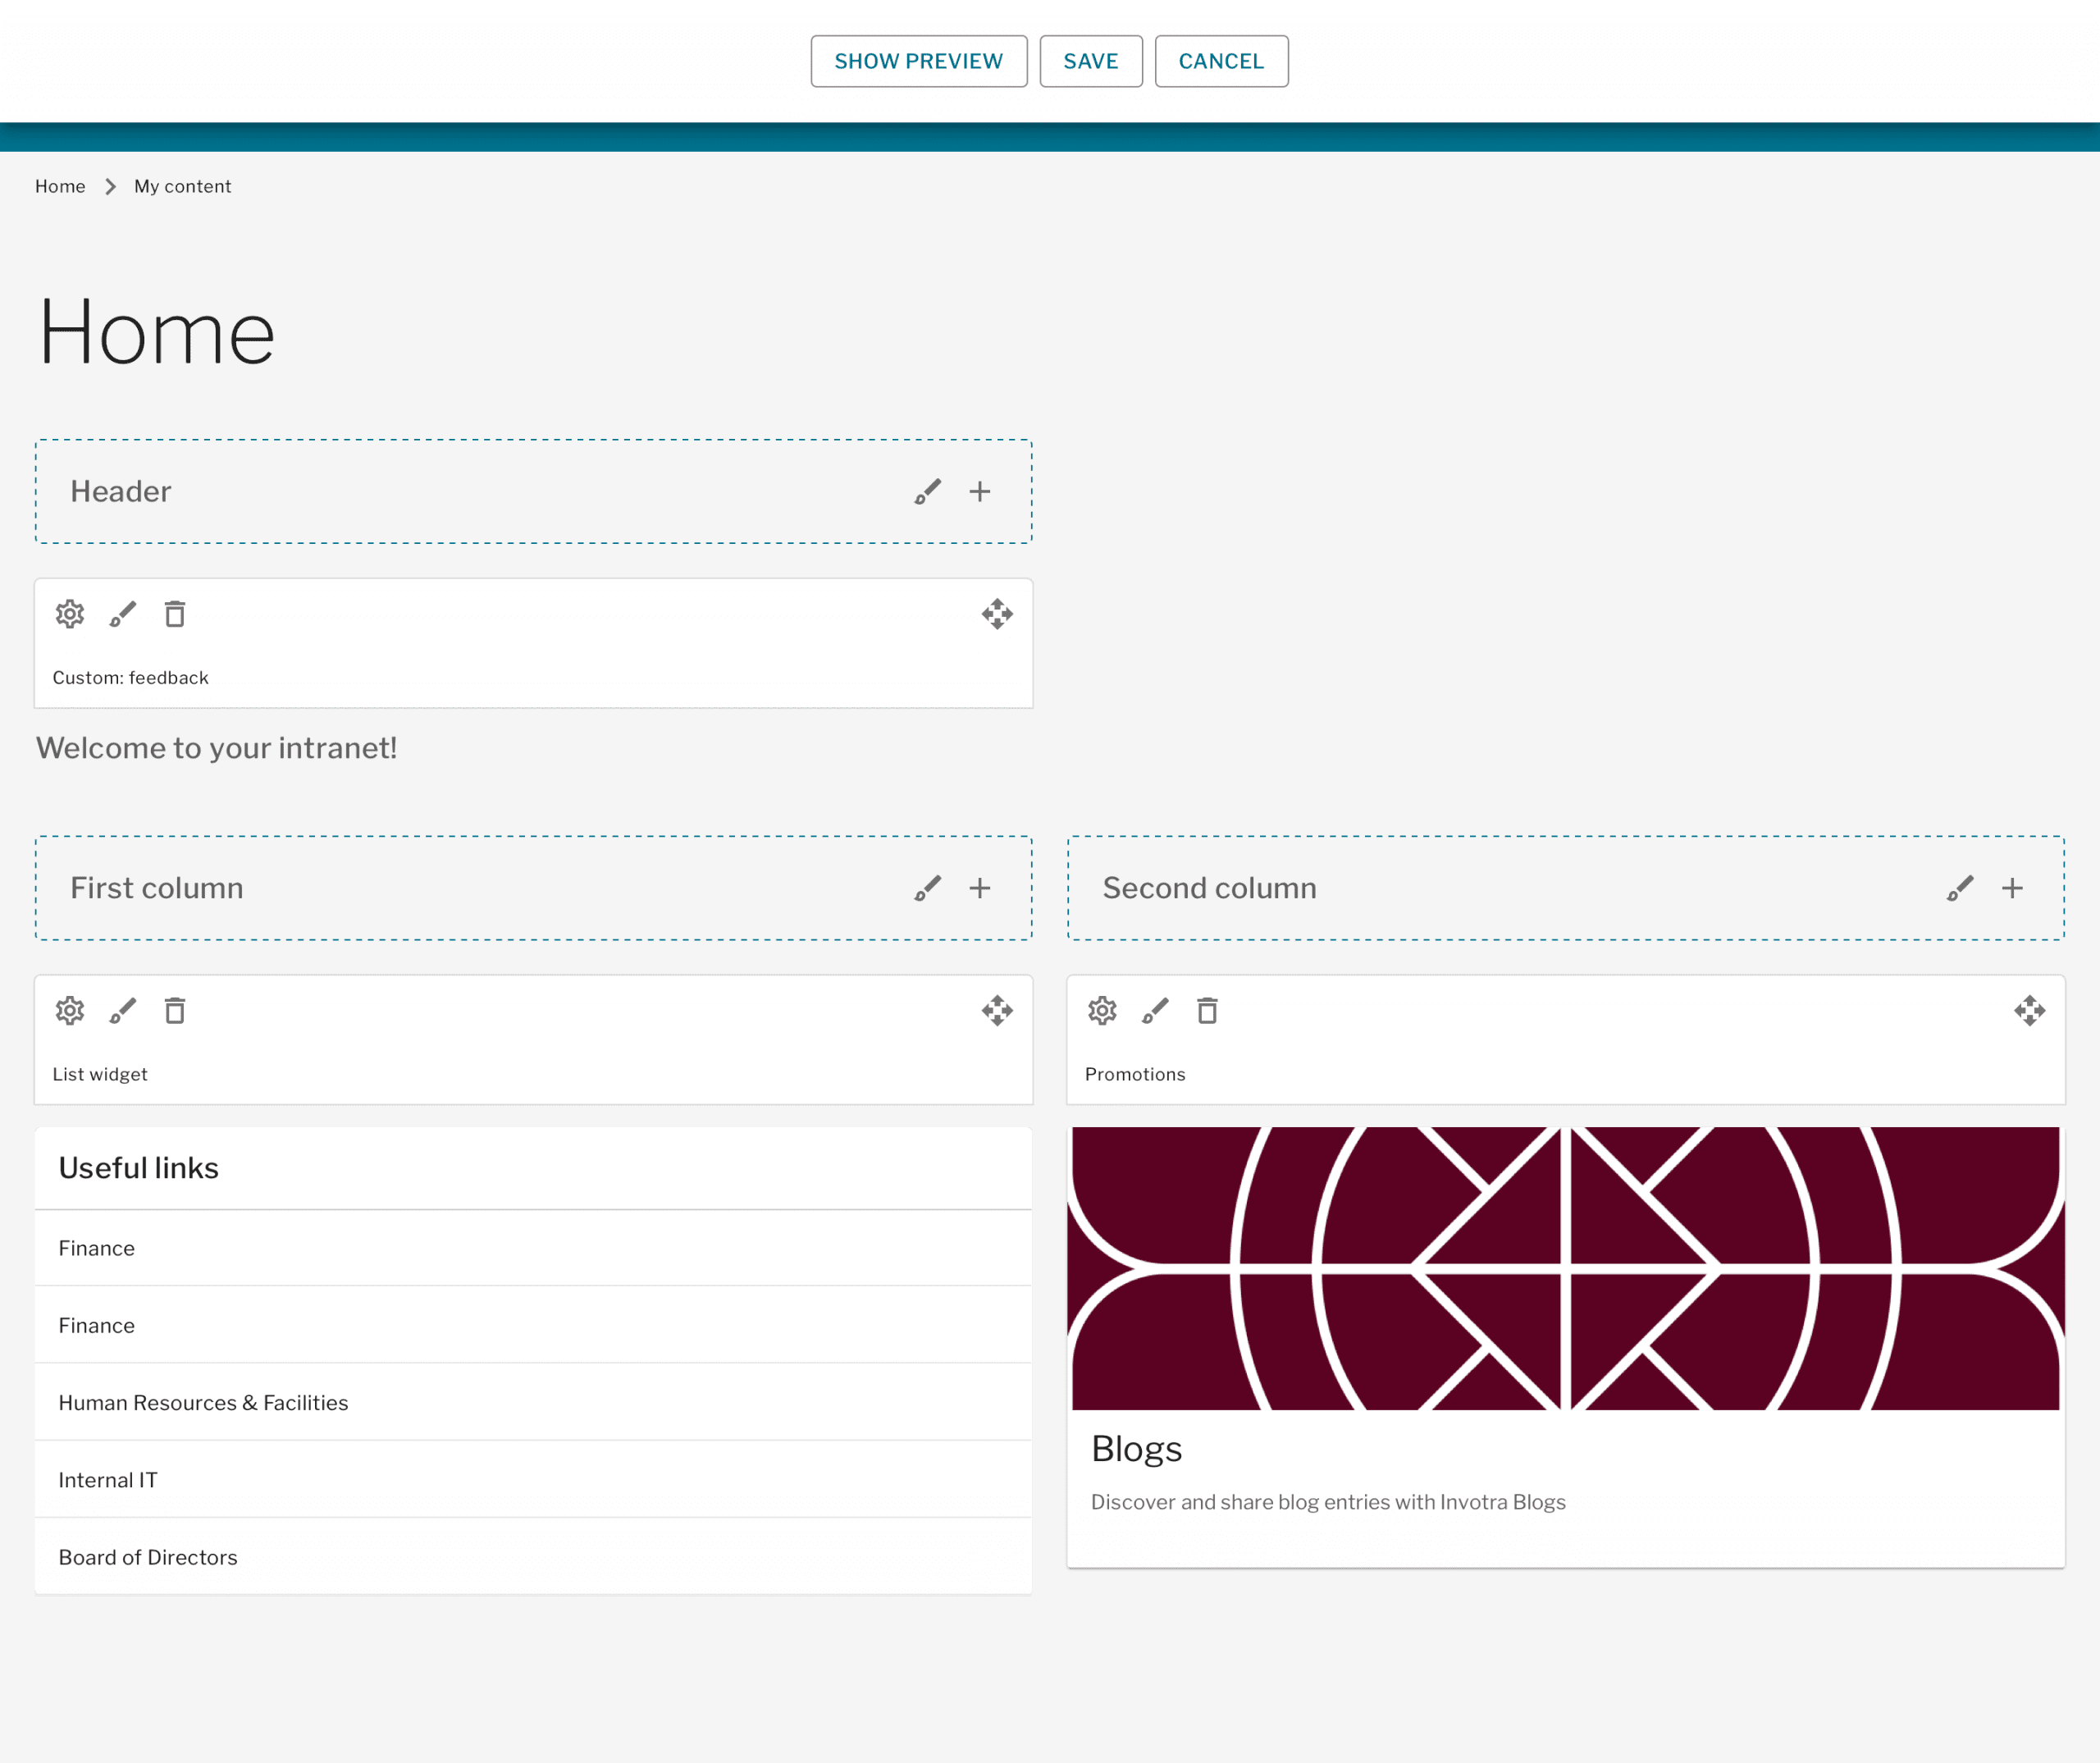
You can also try out different layouts and then perform analysis as to which is more successful. What makes this so great is that you aren’t asking for your users to put any effort into testing or changing the way they behave, you simply monitor them and adjust to improve their UX.
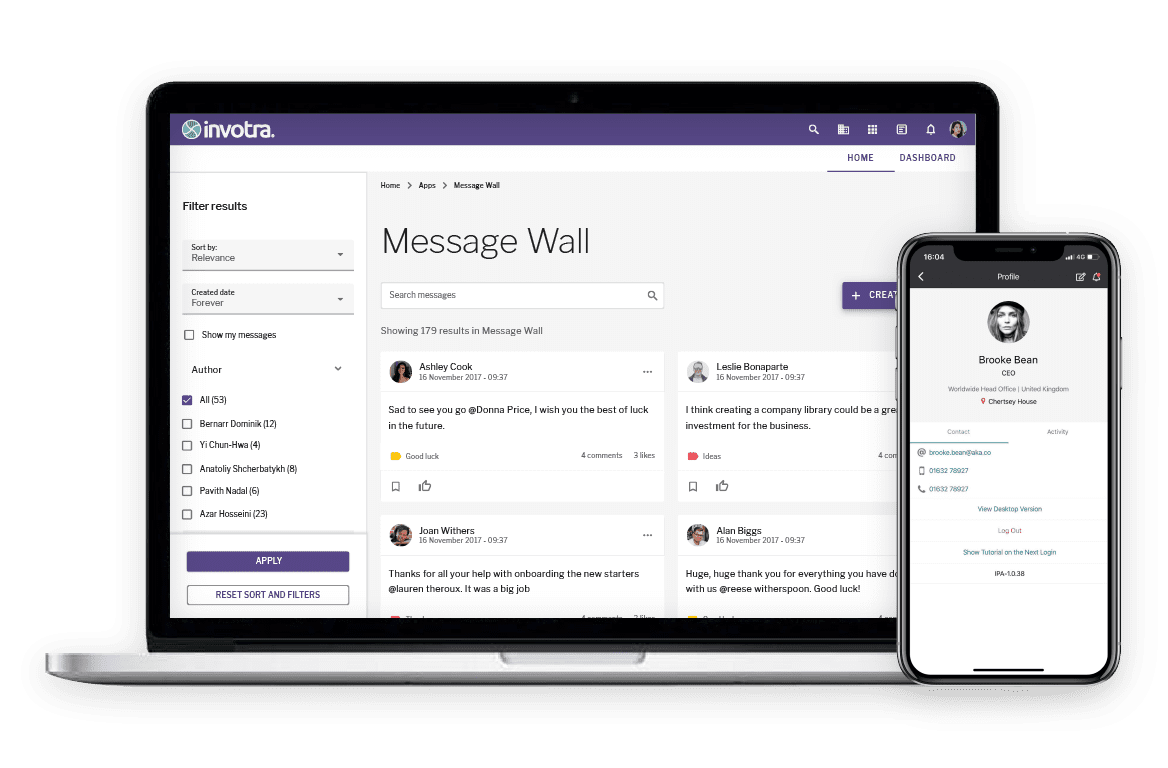
Another way in which our product allows our customers to gain business intelligence is through our intuitive dashboards, which are available for all of our applications and teams.
The image below highlights some of the metrics that our dashboards deliver.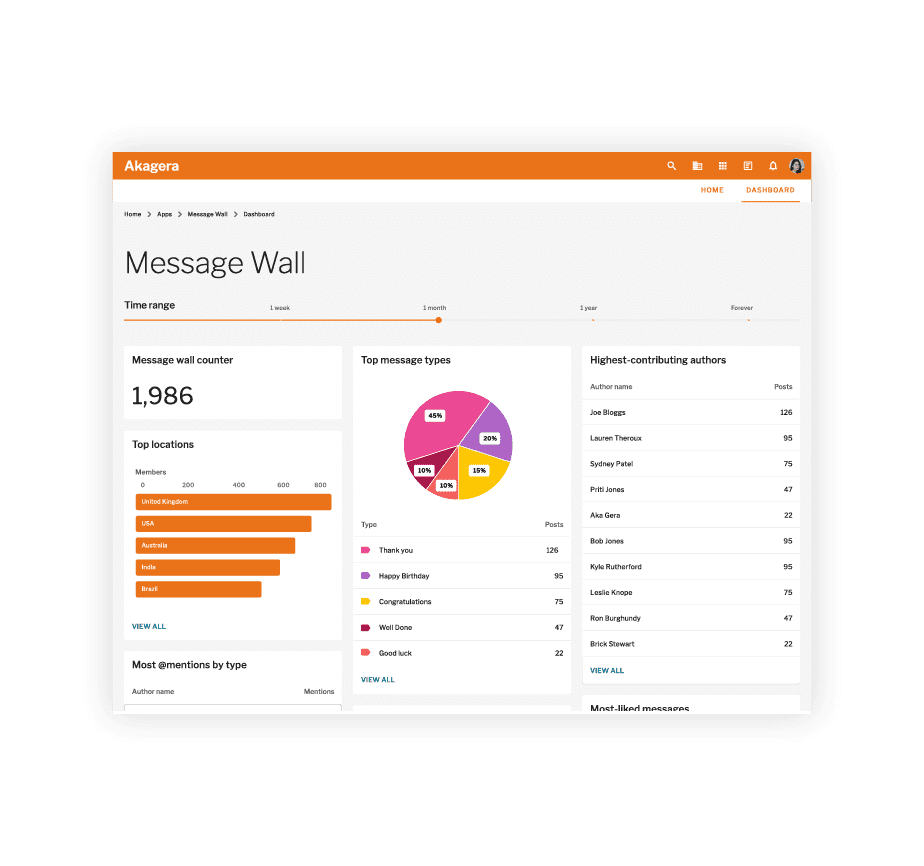
All of these things enable you to roll-out evidence-based improvements to your navigation and content, which in turn should deliver a better user experience and increase engagement within your organisation.